Adding a custom chart to a report
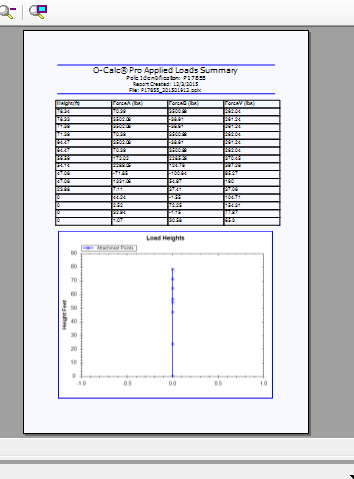
In a previous posting ( http://o-calcpro.com/wiki/2015/12/02/creating-a-real-report/ ) we saw how to create a simple report. In that case it was the Applied Load report. In this article we are going to extend that report by adding a chart of the heights.

O-Calc includes a graphing API that is used to generate all of the graphs that appear on the “Charts” tab of the main interface. To keep a consistent look and feel you can take advantage of that same API when defining your reports.
The following code would be added to the bottom of the “AddPole” (immediately after the FinalizeTable(); cDocument.LastSection.AddParagraph(“\n”); code) method of the report defined in the previous article (see link at the top of this article) and will result in the generation of the chart and its inclusion in the resulting report. See inline documentation for an understanding of the code.
-
using (ZedGraphControl zedGraph = new ZedGraphControl ( ) )
-
{
-
//create the report
-
-
GraphPane graphPane = zedGraph . GraphPane ;
-
graphPane . CurveList . Clear ( ) ;
-
-
// Set the titles and axis labels and get data
-
graphPane . Title . Text = "Load Heights" ;
-
graphPane . XAxis . Title . Text = " " ;
-
if (PPLGridModel . Attribute . UnitsConvention == PPLGridModel . Attribute . UNITS_CONVENTION . METRIC )
-
{
-
graphPane . YAxis . Title . Text = "Height Meters" ;
-
}
-
else
-
{
-
graphPane . YAxis . Title . Text = "Height Feet" ;
-
}
-
-
-
zedGraph . RestoreScale (graphPane ) ;
-
graphPane . YAxis . Type = AxisType . Linear ;
-
graphPane . YAxis . Scale . Mag = 0 ;
-
graphPane . YAxis . Scale . MagAuto = false ;
-
graphPane . YAxis . Scale . IsUseTenPower = false ;
-
graphPane . XAxis . Type = AxisType . Linear ;
-
graphPane . XAxis . Scale . Mag = 0 ;
-
graphPane . XAxis . Scale . MagAuto = false ;
-
graphPane . XAxis . Scale . IsUseTenPower = false ;
-
graphPane . XAxis . MinorGrid . IsVisible = false ;
-
graphPane . YAxis . MinorGrid . IsVisible = false ;
-
-
PointPairList points = new PointPairList ( ) ;
-
-
foreach (ForceSummary fs in loads )
-
{
-
PointPair pp ;
-
if (PPLGridModel . Attribute . UnitsConvention == PPLGridModel . Attribute . UNITS_CONVENTION . METRIC )
-
{
-
pp = new PointPair ( 0, PPLGridModel . Attribute . InchesToMeters (fs . cHeightOfForceApplicationAboveGLinInches ) ) ;
-
}
-
else
-
{
-
pp = new PointPair ( 0, PPLGridModel . Attribute . InchesToFeet (fs . cHeightOfForceApplicationAboveGLinInches ) ) ;
-
}
-
points . Add (pp ) ;
-
}
-
//add the groundline
-
points . Add ( 0, 0 ) ;
-
-
LineItem curve = graphPane . AddCurve ( "Attachment Points", points, Color . Blue, SymbolType . Star ) ;
-
curve . Line . Width = 2 ;
-
-
-
//Add the chart to the report
-
zedGraph . Width = 640 ;
-
zedGraph . Height = 500 ;
-
// signal we are done and rendering can begin
-
zedGraph . AxisChange ( ) ;
-
-
//get the resulting chart as a bitmap
-
Image img = zedGraph . ImageRender ( ) ;
-
-
//save the bitmap to a temp file
-
String fname = System.IO . Path . GetTempFileName ( ) + ".jpg" ;
-
img . Save (fname ) ;
-
-
try
-
{
-
int imgWidth = 0 ;
-
int imgHeight = 0 ;
-
-
using ( System.Drawing . Image bimage = PPL_CorvusImageViewer . CorvusBitmap . FromFile (fname ) )
-
{
-
imgWidth = bimage . Width ;
-
imgHeight = bimage . Height ;
-
bimage . Dispose ( ) ;
-
}
-
-
MigraDoc . DocumentObjectModel . Section section = cDocument . LastSection ;
-
MigraDoc . DocumentObjectModel . Paragraph paragraph = section . LastParagraph ;
-
-
double printableAreaWidth = ReportFont . cPageWidth ;
-
double printableAreaHeight = printableAreaWidth * 3.0 / 4.0 ;
-
-
MigraDoc . DocumentObjectModel . Shapes . Image image = paragraph . AddImage (fname ) ;
-
paragraph . Format . Alignment = MigraDoc . DocumentObjectModel . ParagraphAlignment . Center ;
-
double scaleWidth = printableAreaWidth / ( ( double )imgWidth ) ;
-
double scaleHeight = printableAreaHeight / ( ( double )imgHeight ) ;
-
image . Height = new MigraDoc . DocumentObjectModel . Unit (printableAreaHeight, MigraDoc . DocumentObjectModel . UnitType . Inch ) ;
-
}
-
catch { }
-
}
.png?width=243&name=Osmose-logo-(white).png)